Introduction
Aging is the most influential risk factor for many disease states [1]. Developing interventions in the aging process will require
building a systematic understanding of the underlying causal factors and associated
biomarkers and epigenetic markers that lead to biological and cellular deterioration.
The nine hallmarks of aging are key frameworks for describing such phenomena [2]. Epigenetic alterations, one of the nine hallmarks,
can be accurately measured using DNA methylation (DNAm) levels [3, 39]. DNAm is the process in
which a methyl group is added to the 5’ position on cytosines in cystine guanine
dinucleotides, or CpGs [4]. Epigenetic clocks predict
one’s cellular age by measuring this process of epigenetic deterioration using
methylation data [5] and have been shown to predict
chronological age with a correlation of 0.96 or higher [6]. Since then, many other comparable epigenetic clocks have been
proposed using varying CpG sites, cohorts, and algorithmic approaches.
Phenotypic clocks are an alternative approach to measuring age-related deterioration and
mortality. Phenotypic clocks use easily measurable biological and physiological clinical
biomarkers to quantify aging and disease-related mortality (i.e., “aging scores”) and
have been shown to predict mortality more accurately than chronological age [7–14]. Phenotypic
clocks are easier to model when compared to epigenetic clocks because they use readily
available measurements collected in a standard clinical setting. Additionally, they may
provide insights into intracellular phenomena, while epigenetic clocks only measure at
the cellular level. Further, changes in lifestyle, such as diet or exercise, are more
readily manifested in alterations in these clinical biomarkers, providing valuable
feedback that may be actionable.
This study aims to comprehensively survey existing research on epigenetic and phenotypic
clocks. This survey extends previous systematic reviews and meta-analyses on epigenetic
clocks [15, 16] by
including recent epigenetic clocks using artificial neural networks, as well as
providing greater focus on phenotypic clocks. To achieve these goals, this study
conducted an extensive systematic review of all epigenetic and phenotypic age
measurement literature, the first study of its kind. This study fills a critical gap in
the literature by synthesizing studies on epigenetic clocks and phenotypic clocks, with
a focus on the clinical utility of each.
Methods
This systematic review was designed in accordance with the Preferred Reporting Items for
Systematic Reviews and Meta-Analyses (PRISMA) guidelines for protocol, search strategy,
and risk of bias assessment [17].
Search strategy
A comprehensive literature search was performed on June 8, 2023, and was conducted
using the PubMed online database. Additionally, a grey literature (i.e., citation
tracing) and Google Scholar search were conducted to ensure optimal coverage of
other journals and preprint publications. PubMed search terms included ‘epigenetic
clock’ OR ‘biomarker clock’ AND aging, cellular (MeSH Terms) OR dna methylation
(MeSH Terms) OR methylation, dna (MeSH Terms) OR longevity (MeSH Terms) AND
biomarkers (MeSH Terms) OR ‘phenotypic’. After the search was complete, resources
were screened according to the inclusion criteria outlined in the following section.
A visual representation of the search strategy is shown in Figure 1.
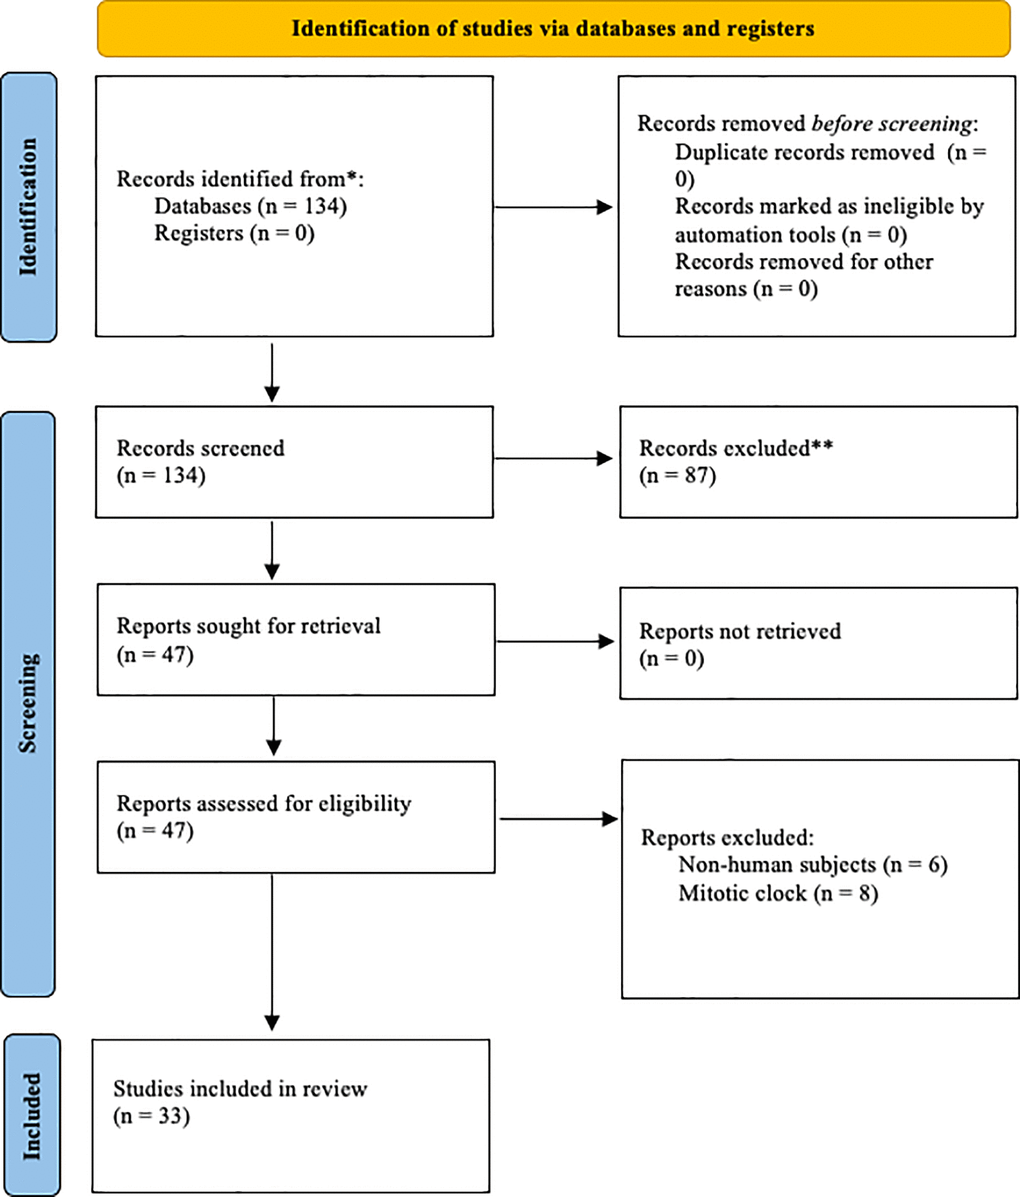
Figure 1. Prisma diagram illustrating
the search process and exclusion criteria.
Inclusion and exclusion criteria
The included articles were limited to primary studies (i.e., non-reviews) available
in the English language that concerned human subjects. We included clocks that used
human blood or saliva samples to predict chronological age, phenotypic age, or
mortality risk. We did not include mitotic clocks used to predict cancer risk and
progression since this is outside the scope of this review. Furthermore, we excluded
papers that were not primary studies (i.e., papers that reproduced and compared
already published clocks).
Data extraction
Studies that fit the inclusion criteria were analyzed according to various
descriptive statistics provided in the original literature. These included the
publication year, type of clock, number of CpGs or blood biomarkers used, number of
subjects, and accuracy of prediction (r). Additionally, we extracted model
coefficients for the most influential plasma biomarkers used in phenotypic clocks.
Results
Study selection
The initial search resulted in 134 articles. After abstract screening, 87 articles
were excluded. After full-text screening, 14 articles were removed. This yielded 33
included studies. Included studies featured a variety of biological clocks,
including methylation-based clocks, mortality clocks, and phenotypic clocks. Table 1 presents the characteristics and
performance of all the included clocks in our study.
Table 1. Descriptive statistics of all included first-generation epigenetic
clocks.
| References
|
# of CpGs
|
n
subjects |
Performance
(r) |
| Horvath et al. (2020) [18] |
36,000 |
850 |
0.990 |
| Q. Zhang et al. (2019) [19] |
514 |
13,566 |
0.990 |
| de Lima Camillo et al. (2022) [20]
|
20,318 |
8,050 |
0.980 |
| Galkin et al. (2021) [21] |
24,538 |
1,293 |
0.980 |
| Vidaki et al. (2017) [22] |
16 |
1156 |
0.980 |
| Correia Dias et al. (2020) [23]
|
4 |
53 |
0.977 |
| Bekaert et al. (2015) [24] |
4 |
206 |
0.973 |
| Lee et al. 2020) [25] |
1791 |
2,227 |
0.970 |
| Thong et al. (2021) [26] |
3 |
196 |
0.969 |
| Levy et al. (2020) [27] |
300,000 |
503 |
0.960 |
| X. Li et al. (2018) [28] |
6 |
539 |
0.960 |
| Horvath et al. (2018) [29] |
391 |
3931 |
0.960 |
| Horvath, (2013) [30] |
353 |
3,931 |
0.960 |
| Han et al. (2020) [31] |
9 |
973 |
0.943 |
| Weidner et al. (2014) [32] |
99 |
656 |
0.933 |
| Garagnani et al. (2012) [33] |
1 |
64 |
0.920 |
| Hannum et al. (2013) [34] |
71 |
482 |
0.905 |
| Freire-Aradas et al. (2018) [35]
|
6 |
180 |
0.893 |
| Florath et al. (2014) [36] |
17 |
249 |
0.880 |
| Koch and Wagner (2011) [37] |
5 |
130 |
0.825 |
| Vidal-Bralo et al. (2016) [38]
|
8 |
390 |
0.775 |
| Naue et al. (2017) [43] |
13 |
208 |
NR |
| Accuracy (r) represents the Pearson’s correlation
coefficient of the predicted ages with the true ages in the
validation set. NR stands for ‘not reported.’ Clocks are sorted by
performance in descending order. |
Epigenetic clocks
Epigenetic clocks generally follow the standard protocol for regression problems.
After data acquisition, one may conduct feature (i.e., CpG) selection and/or
dimensionality reduction approaches in hopes of optimizing the prediction of the
output (in this case, chronological age). The Pearson correlation coefficient of the
predicted age and the “true” chronological age is the most common metric used in the
literature to measure such performance. Below, we outline the performance of all
included epigenetic clocks along with their respective modeling statistics,
including the number of CpGs and the number of subjects. In some cases, the authors
of the original literature chose a different validation metric. In these cases, we
denoted their performance as “not reported” (NR). In the results below, we separate
our epigenetic clock findings into three categories: first-generation,
second-generation, and third-generation. We do so because each of these types of
approaches are fundamentally different from the others and a direct comparison would
not be appropriate.
First-generation clocks
Epigenetic clocks may be divided into several distinct generations. First-generation
clocks rely on cross-sectional data alone to investigate the association of
biomarkers with chronological age. In these approaches, deviations between the true
chronological age and the predicted age are treated as indications of accelerated or
decelerated aging. Horvath’s first epigenetic clock (Horvath, 2013) inspired a
wealth of research into this type of approach and many studies have substantiated
this hypothesis by confirming that accelerated epigenetic aging is associated with
various deleterious phenotypes, including post-traumatic stress (Boks et al., 2015),
obesity (Horvath et al., 2014), and more. Additionally, increased epigenetic age has
been shown to predict mortality later in life (Marioni et al., 2015), albeit
moderately. We present a collection of characteristics and prediction performances
of first-generation clocks below.
Second-generation clocks
While first-generation clocks made great progress in understanding the mechanistic
properties of cellular aging, various drawbacks are inherent to the chronological
age approach. First, Horvath, and Raj (2018) concluded that first-generation clocks
are only able to provide weak associations with physiological measures of
dysregulation. Secondly, and perhaps most critical, is the paradox of chronological
age. Zhang et al. (2018) found that DNAm levels can, theoretically, provide perfect
chronological age predictions if enough data is available, but useful mortality and
phenotypic associations attenuate as predictions near perfection. Consequently,
second-generation clocks were proposed to address these concerns. Rather than using
candidate biomarkers to predict chronological age, second-generation clocks
investigate the association of biomarkers with time-to-event data, specifically
time-to-mortality. The most influential second-generation clocks include PhenoAge
(Levine, 2018), GrimAge (Lu et al., 2018), and MetaboHealth (Deelin et al., 2019).
Each of these approaches used very different strategies to predict mortality risk.
PhenoAge used calendar age and 9 clinical measurements to predict phenotypic age,
which was then used to regress on DNAm levels to identify 513 CpG sites that
influence disease and mortality among those of the same calendar age. GrimAge used
12 plasma proteins and smoking pack-years regressed on all-cause mortality,
identifying 1030 influential CpG sites. Lastly, MetaboHealth used metabolic
predictors to identify 14 biomarkers independently associated with all-cause
mortality. Each of these approaches exhibited greater strengths of association with
all-cause mortality than first-generation clocks.
Third-generation clocks
Third-generation clocks are characterized by the use of longitudinal data to predict
aging rates. The most noteworthy third-generation clock is DunedinPoAm [36], which measured longitudinal changes of 18
clinical biomarkers to predict rates of aging. Like second-generation clocks,
DundeinPoAm exhibited superior mortality risk prediction than first-generation
clocks. A few other longitudinal studies have been conducted using methylation data
[93–95]. As
longitudinal data becomes more readily available, third-generation clocks will
become more prevalent due to their predictive power.
First-generation clock modelling decisions and performance
Unsurprisingly, there is a wide range in predictive performance of the various clocks
due to heterogeneous data sources. The clocks that featured the highest correlation
with chronological age were [18, 19], with Pearson correlations of 0.990 with the output.
Interestingly, Horvath’s clock used 36,000 CpG sites in the model, significantly
more than the number of training samples. The authors did so by employing feature
selection methods based on model coefficients extracted from linear models. The
Horvath clock [18] used penalized regression
models, while the Zhang clock [19] used elastic
net regression. [20–22] attained the next best correlated predictions (R = 0.98)
and were all based on artificial neural networks (ANNs). [22] built multiple ANNs, including multi-layer perceptrons
(MLPs), radial bias functions (RBFs), probabilistic neural networks (PNNs), and
generalized regression neural networks (GRNNs). Both [20] and [22] built deep
learning models, but [20] paired their model with
SHAP (Shapley Additive Explanations) [92] values
to provide interpretability.
Phenotypic clocks
While biological clocks have focused more on methylation data in recent years,
phenotypic clocks also provide valuable longevity estimations using readily
available clinical measurements. To that end, phenotypic clocks have been proven to
predict mortality more accurately than chronological age in a variety of scenarios
[8–14, 35].
Klemera and Doubal [40] were the first to prove
that biological age estimates using purely clinical values provided more robust
measurements of mortality than chronological age. Since then, phenotypic models have
largely focused on using proportional hazard and survival models such as the
Gompertz mortality model [10, 41]. These models often use chronological age along with
other biomarkers of aging to predict mortality. [40] were the first to use chronological age as a biomarker
and anticipated this would be viewed as controversial due to the heterogeneity of
aging processes among different people.
Before Klemera and Doubal’s method, most phenotypic models fell under three
categories: multiple linear regression (MLR), principal component analysis (PCA), or
Hochschild’s method [42]. MLR models choose
biomarkers according to their correlation with chronological age and were
established by Hollingsworth [43] and others. MLR
models are simple to implement but distort the biological age at the regression edge
(i.e., at the youngest and oldest ages). PCA-based biological clocks avoid
distortion at the regression edge but cannot avoid the paradox of chronological age
[44]. Hochschild’s method solves the paradox of
chronological age but is nonstandard and somewhat complex to implement. Klemera and
Doubal’s method improves on each of these methods by solving the paradox of aging by
minimizing the distance between regression lines for each biomarker point, providing
a better estimation of mortality than chronological age. [50] evaluated multiple variations of both the Klemera and
Doubal phenotypic clock and frailty indices [78–79] and evaluated their performance both with and
without chronological age as an input variable. The authors found that the models
without chronological age input captured the most variability of mortality
indicators, though more research is needed on this subject.
Unlike epigenetic clocks, phenotypic clocks may be modeled using a variety of
approaches. Klemera and Doubal’s popular approach uses chronological age as one of
the input biomarkers, along with other standard biomarkers such as blood glucose.
However, using chronological age to calculate biological age is a somewhat
controversial modeling decision. This can, as expected, lead to a very high
correlation, as shown in Table 2.
Table 2. Descriptive statistics of phenotypic clocks that use chronological age
as input.
| References
|
Output
variable |
#
biomarkers |
n
subjects |
Performance
(r) |
| Chen et al. (2023) [45] |
Chronological |
12 |
12,377 |
0.980 |
| Liu et al. (2018) [41] |
Chronological |
13 |
11,432 |
0.960 |
| Levine (2013) [9] |
Chronological |
13 |
9,389 |
NR |
| Accuracy (r) represents the Pearson’s correlation
coefficient of the predicted ages with the true ages in the
validation set. NR stands for ‘not reported.’ Clocks are sorted by
performance in descending order. |
There are, however, phenotypic clocks that do not use chronological age as input to
the model. A variety of modeling structures have been employed to calculate
phenotypic age in this way. Putin et al. (2016) used an ensemble of deep neural
networks, while Husted et al. (2022) and Park et al. (2009) used principal component
analysis (PCA) approaches. [14] used a very
different approach, employing agglomerative clustering to determine influential
biomarkers in aging and mortality processes. The performance and descriptive
statistics of each of these models are shown in Table
3.
Table 3. Descriptive statistics of phenotypic clocks that do not use
chronological age as input.
| Reference
|
Output
variable |
#
biomarkers |
n
subjects |
Performance
(r) |
| Putin et al. (2016) [47] |
Chronological |
41 |
62,419 |
0.910 |
| Husted et al. (2022) [48] |
Chronological |
9 |
100 |
0.86 |
| Park et al. (2009) [46] |
Chronological |
11 |
1588 |
0.762 |
| Nakamura and Miyao, (2007) [49]
|
Chronological |
5 |
86 |
0.720 |
| Sebastiani et al. (2017) [14] |
N/A (unsupervised clustering) |
19 |
4704 |
NR |
| Accuracy (r) represents the Pearson’s correlation
coefficient of the predicted ages with the true ages in the
validation set. NR stands for ‘not reported.’ Clocks are sorted by
performance in descending order. |
Despite widespread use in epigenetic clocks, artificial neural networks have, to our
knowledge, only been employed in one phenotypic clock. [47] used an ensemble of 21 deep neural networks (DNNs) of
varying structure and depth to predict chronological age using physiological
biomarkers alone. Furthermore, the authors paired their model with a feature
importance wrapper-based strategy called Permutation Feature Importance (PFI), which
allowed the authors to ascertain which variables are most influential in the model.
The authors attained impressive prediction performance (r = 0.91), but the dataset
used in the experiments is not open-source and, thus, is not reproducible.
Biomarker importance in phenotypic clocks
Many phenotypic clocks are modeled using linear models due to their ease of
interpretability. Unlike artificial neural networks, information from linear models
can be directly extracted from coefficients in the model. These coefficients measure
the relative importance of each feature in the model and can be used to better
understand the model’s predictions. Many phenotypic clocks identified the same
plasma biomarkers as most influential in the aging process. A brief analysis of
model coefficients (i.e., feature contribution) used in phenotypic clocks was
conducted to identify which plasma biomarkers were consistently found to be
influential in primary literature. The varying magnitude of the coefficients can be
attributed to the other features included in each of the models. The results of this
analysis are reported in Table 4.
Table 4. Clinical plasma biomarkers and their respective regression
coefficients.
| Biomarker
|
Nakamura and
Miyao, (2007) [49] |
Levine, (2013)
[10] |
Mitnitski et
al., (2017) [50] |
Liu et al.,
(2018) [41] |
| Systolic blood pressure |
0.580 |
0.501 |
−0.008 |
NR |
| Diastolic blood pressure |
0.405 |
0.047 |
−0.130 |
NR |
| Forced expiratory volume |
−0.626 |
−0.535 |
NR |
NR |
| White blood cell count |
−0.115 |
−0.020 |
0.021 |
NR |
| Red blood cell count |
−0.367 |
−0.096 |
NR |
NR |
| Hemoglobin |
−0.299 |
0.261 |
−0.246 |
NR |
| Hematocrit |
−0.435 |
−0.036 |
NR |
NR |
| C-reactive protein (log) |
NR |
0.122 |
NR |
0.0954 |
| Albumin |
−0.310 |
−0.220 |
−0.236 |
−0.0336 |
| Lymphocyte (%) |
NR |
−0.033 |
NR |
0.0120 |
| Alkaline phosphatase |
−0.333 |
0.218 |
0.081 |
0.00188 |
| Creatinine |
0.181 |
0.148 |
0.142 |
0.0095 |
| Blood glucose |
0.129 |
NR |
0.036 |
0.0195 |
| NR was given for biomarkers that were “not reported”
in the primary literature. |
Discussion
Phenotypic age, health-status, and mortality
Biological aging measurements using clinically observable data (i.e., phenotypes)
have produced robust estimations and predictions of aging-related outcomes and
mortality [41]. Much of recent biological clock
research has focused on methylation data, but phenotypic features also offer
powerful mortality and aging predictive power [35]. Phenotypic variables offer benefits at multiple levels
in that they provide crucial insights into the physiological state of the subject in
addition to providing an aggregate measure, albeit indirect, of the changes in
various hallmarks of aging. Perhaps most importantly, changes in these phenotypic
biomarkers are mechanistically linked to organ and cellular functions and, by
extension, health outcomes and health span. Most of these phenotypic biomarkers are
also highly actionable with lifestyle and dietary changes within a reasonably short
period of time. Finally, they are much easier to collect than molecular measures due
to lower cost and technology barriers. This suggests that phenotypic clocks could be
easier to scale than epigenetic clocks since these measures are routinely collected
in clinical settings at relatively affordable cost and the health benefits of
tracking one’s phenotypic age are easily understood both by the individual and the
healthcare system.
Epigenetic clock associations with health and mortality
Epigenetic clocks have been shown to be significantly associated with various
deleterious phenotypes. Multiple epigenetic clocks have found that body mass index
(BMI) is correlated with increased epigenetic age, but further research is needed to
better understand this relationship [51, 52]. To our knowledge, only one longitudinal
study has found obesity to be the cause, rather than a consequence, of increased
epigenetic age [53]. Multiple clocks found that
high levels of alcohol intake were associated with increased epigenetic age.
However, moderate levels of alcohol intake were not associated with increased
epigenetic age, suggesting a non-linear relationship. Other disease states
associated with elevated biological age include HIV [54–57], chronic obstructive
pulmonary disease (COPD) [41, 58, 59], schizophrenia [60], post-traumatic stress disorder (PTSD) [61], smoking [62–67], particulate matter
[68–70],
diabetes [71–75], frailty [76] and
socioeconomic status [77]. Recently, Noroozi et
al. (2023) [96] identified several lifestyle and
socio-economic variables impacting epigenetic aging rates, including sleep quality,
education level, yoga practice, and more.
Epigenetic clocks in vitro vs. in vivo
A key advantage of epigenetic clocks is their ability to provide robust aging
estimations across tissues, physiological systems, and life stages. Unlike
phenotypic clocks, epigenetic clocks are able to measure cellular changes both in
vitro and in vivo. Additionally, they are able to generalize across
tissues [20], making them particularly useful in
both clinical and research settings. Furthermore, epigenetic clocks have been shown
to provide insights into systemic physiological changes using only blood samples [97]. A recent clock, SystemsAge [97], proved that single blood DNA methylation tests have the
ability to capture heterogeneous aging patterns across physiological systems. Their
findings showed that providing scores for each physiological system can more
accurately capture disease risk, better facilitating personalized care plans
compared to a single global aging metric.
Dimensionality reduction
Many biological clocks have utilized dimensionality reduction for a variety of
reasons. First, methylation data is highly dimensional, with the common 450k arrays
producing over 450,000 features. Additionally, high levels of entropy can often be
present in methylation data due to various causes, including sample preparation,
beads per CpG, batch effects, and probe chemistry and hybridization issues [80–84].
Dimensionality reduction can reduce noise caused by such deviations because entropy
will likely not covary across features. Lastly, dimensionality reduction can provide
significant improvements in computational tractability. The most common
dimensionality reduction method used in extant biological clock literature is
Principal Component Analysis (PCA) [85, 86, 49]. PCA is
a computationally tractable linear dimensionality reduction approach and has proven
to increase the accuracy of predictions in a variety of cohorts. In recent years,
various non-linear dimensionality reduction methods have been proposed, including
Isometric Mapping (Isomap), t-Distributed Stochastic Neighbor Embedding (t-SNE), and
Unified Manifold Approximation and Projection (UMAP) [87]. To date, only one biological clock (DeepMAge) has
utilized these more complex, non-linear approaches [21]. The authors attained state-of-the-art performance, but
additional research is needed to address whether predictive improvements are
significant enough to warrant the increased computational expense of non-linear
dimensionality reduction techniques.
Limitations
The main limitation of this review is the inability to objectively measure
performance across heterogeneous cohorts and environments. Recent research has
provided such objective comparisons [88–91]. This review set out to instead provide a
comprehensive layout of extant research into two disparate but related fields:
epigenetic clocks and phenotypic clocks. Additionally, this review is limited by its
exclusion criteria, namely mitotic clocks and clocks that were built using non-human
subjects. Consequently, this review did not seek to provide objective statistics to
measure the performance of various methods. Lastly, this review was limited by its
exclusion of non-English publications.
BW was involved in planning, literature review, draft writing, and final manuscript writing.
ER contributed to the planning, supervision, draft writing and review, and final manuscript
writing and review. AD assisted with draft writing, draft review, and final manuscript
review. AL contributed by draft and final manuscript review.
The authors declare no conflicts of interest related to this study.
No external funding was used in this paper.